Bên cạnh Phân tích & Bài Sửa HS đạt 7.0"The diagram below shows how to recycle organic waste to produce fertiliser (compost)" IELTS WRITING TASK 1 , IELTS TUTOR hướng dẫn Giải đề"The graph below shows the unemployment rates for the United Kingdom, the rest of Europe, and Japan from 1993 to 2007." IELTS WRITING TASK 1 (Đề thi 24/2/2024)
I. Đề bài
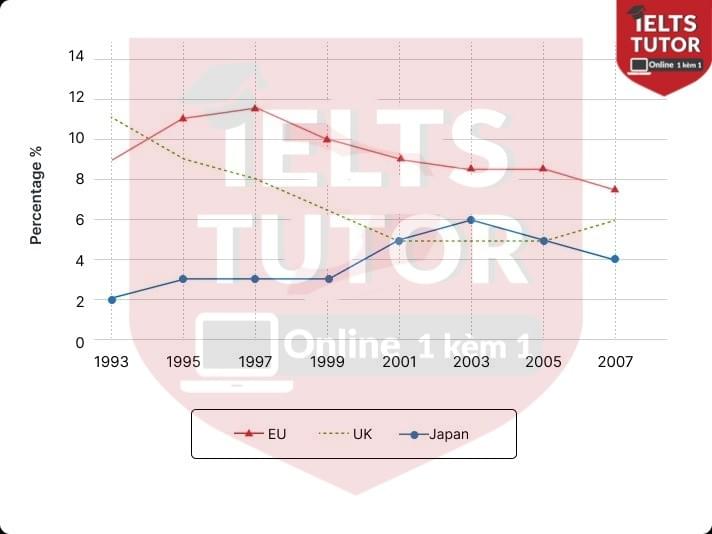
The graph below shows the unemployment rates for the United Kingdom, the rest of Europe, and Japan from 1993 to 2007
II. Kiến thức liên quan
IELTS TUTOR hướng dẫn:
III. Phân tích
- Dạng biểu đồ này thì đã rất quen thuộc với các bạn học sinh lớp IELTS ONLINE WRITING 1 KÈM 1 của IELTS TUTOR rồi nhé
- Overall:
- Japan observed a rise in unemployment percentages, while other regions displayed a different trend.
- European nations consistently reported the highest unemployment rates throughout the surveyed period, except in 1993 when the UK took the lead.
- Body 1: Viết về EU + UK
- Viết về UK
- At the start of the timeframe, the UK had the highest unemployment rate, reaching approximately 11%. This percentage then dropped significantly to a minimum of 5% after 8 years, holding steady until 2005 when it saw a minor increase of 1% in the final year. >> IELTS TUTOR hướng dẫn PHÂN TÍCH ĐỀ THI 30/5/2020 IELTS WRITING TASK 2 (kèm bài sửa HS đạt 6.5)
- Viết về EU
- The EU exhibited a similar downward trend, initiating the period at 9% and surpassing the UK by 1997, peaking at nearly 12% before sharply declining to just under 8%.
- Viết về UK
- Body 2: Viết về Japan
- Japan, with the lowest initial unemployment rate of 2%, experienced a slight increase to 3% in 1995, followed by a stabilization over the next 4 years.
- From 1999 onward, Japan's unemployment rate grew substantially, reaching a peak of 6% in 2003, but by the end of the period, it had decreased to 4%.
- Overall:

Các khóa học IELTS online 1 kèm 1 - 100% cam kết đạt target 6.0 - 7.0 - 8.0 - Đảm bảo đầu ra - Thi không đạt, học lại FREE
>> Thành tích học sinh IELTS TUTOR với hàng ngàn feedback được cập nhật hàng ngày


